
 Available in US
Content

My first attempt at building a rugby betting model was embarrassingly crude — a spreadsheet with team names, recent scores, and an average. It produced results that were marginally better than guessing. Three years and several hundred hours of iteration later, I have a model that identifies value on roughly 15-20% of the matches I assess. The difference between version one and the current version is not complexity for its own sake — it is understanding what actually drives scoring in rugby and how to translate that understanding into numbers.
Mark Oliver of Oliver and Ohlbaum Associates captured the broader problem well: rugby stakeholders have spent too much time trying to eke out incremental commercial returns without doing enough to engage fans and followers more regularly and meaningfully. The same critique applies to most publicly available rugby statistics. The data exists, but it is fragmented, inconsistently formatted, and rarely presented in a way that supports predictive modelling. Building a useful model means doing the assembly work yourself.
What an Expected Points Model Actually Does
An expected points model — xP, in the shorthand — assigns a predicted score to each team in a given match based on measurable inputs. It is not trying to predict the exact scoreline. It is estimating the most likely range of outcomes and, from that range, deriving a probability for each side to win, lose, or draw.
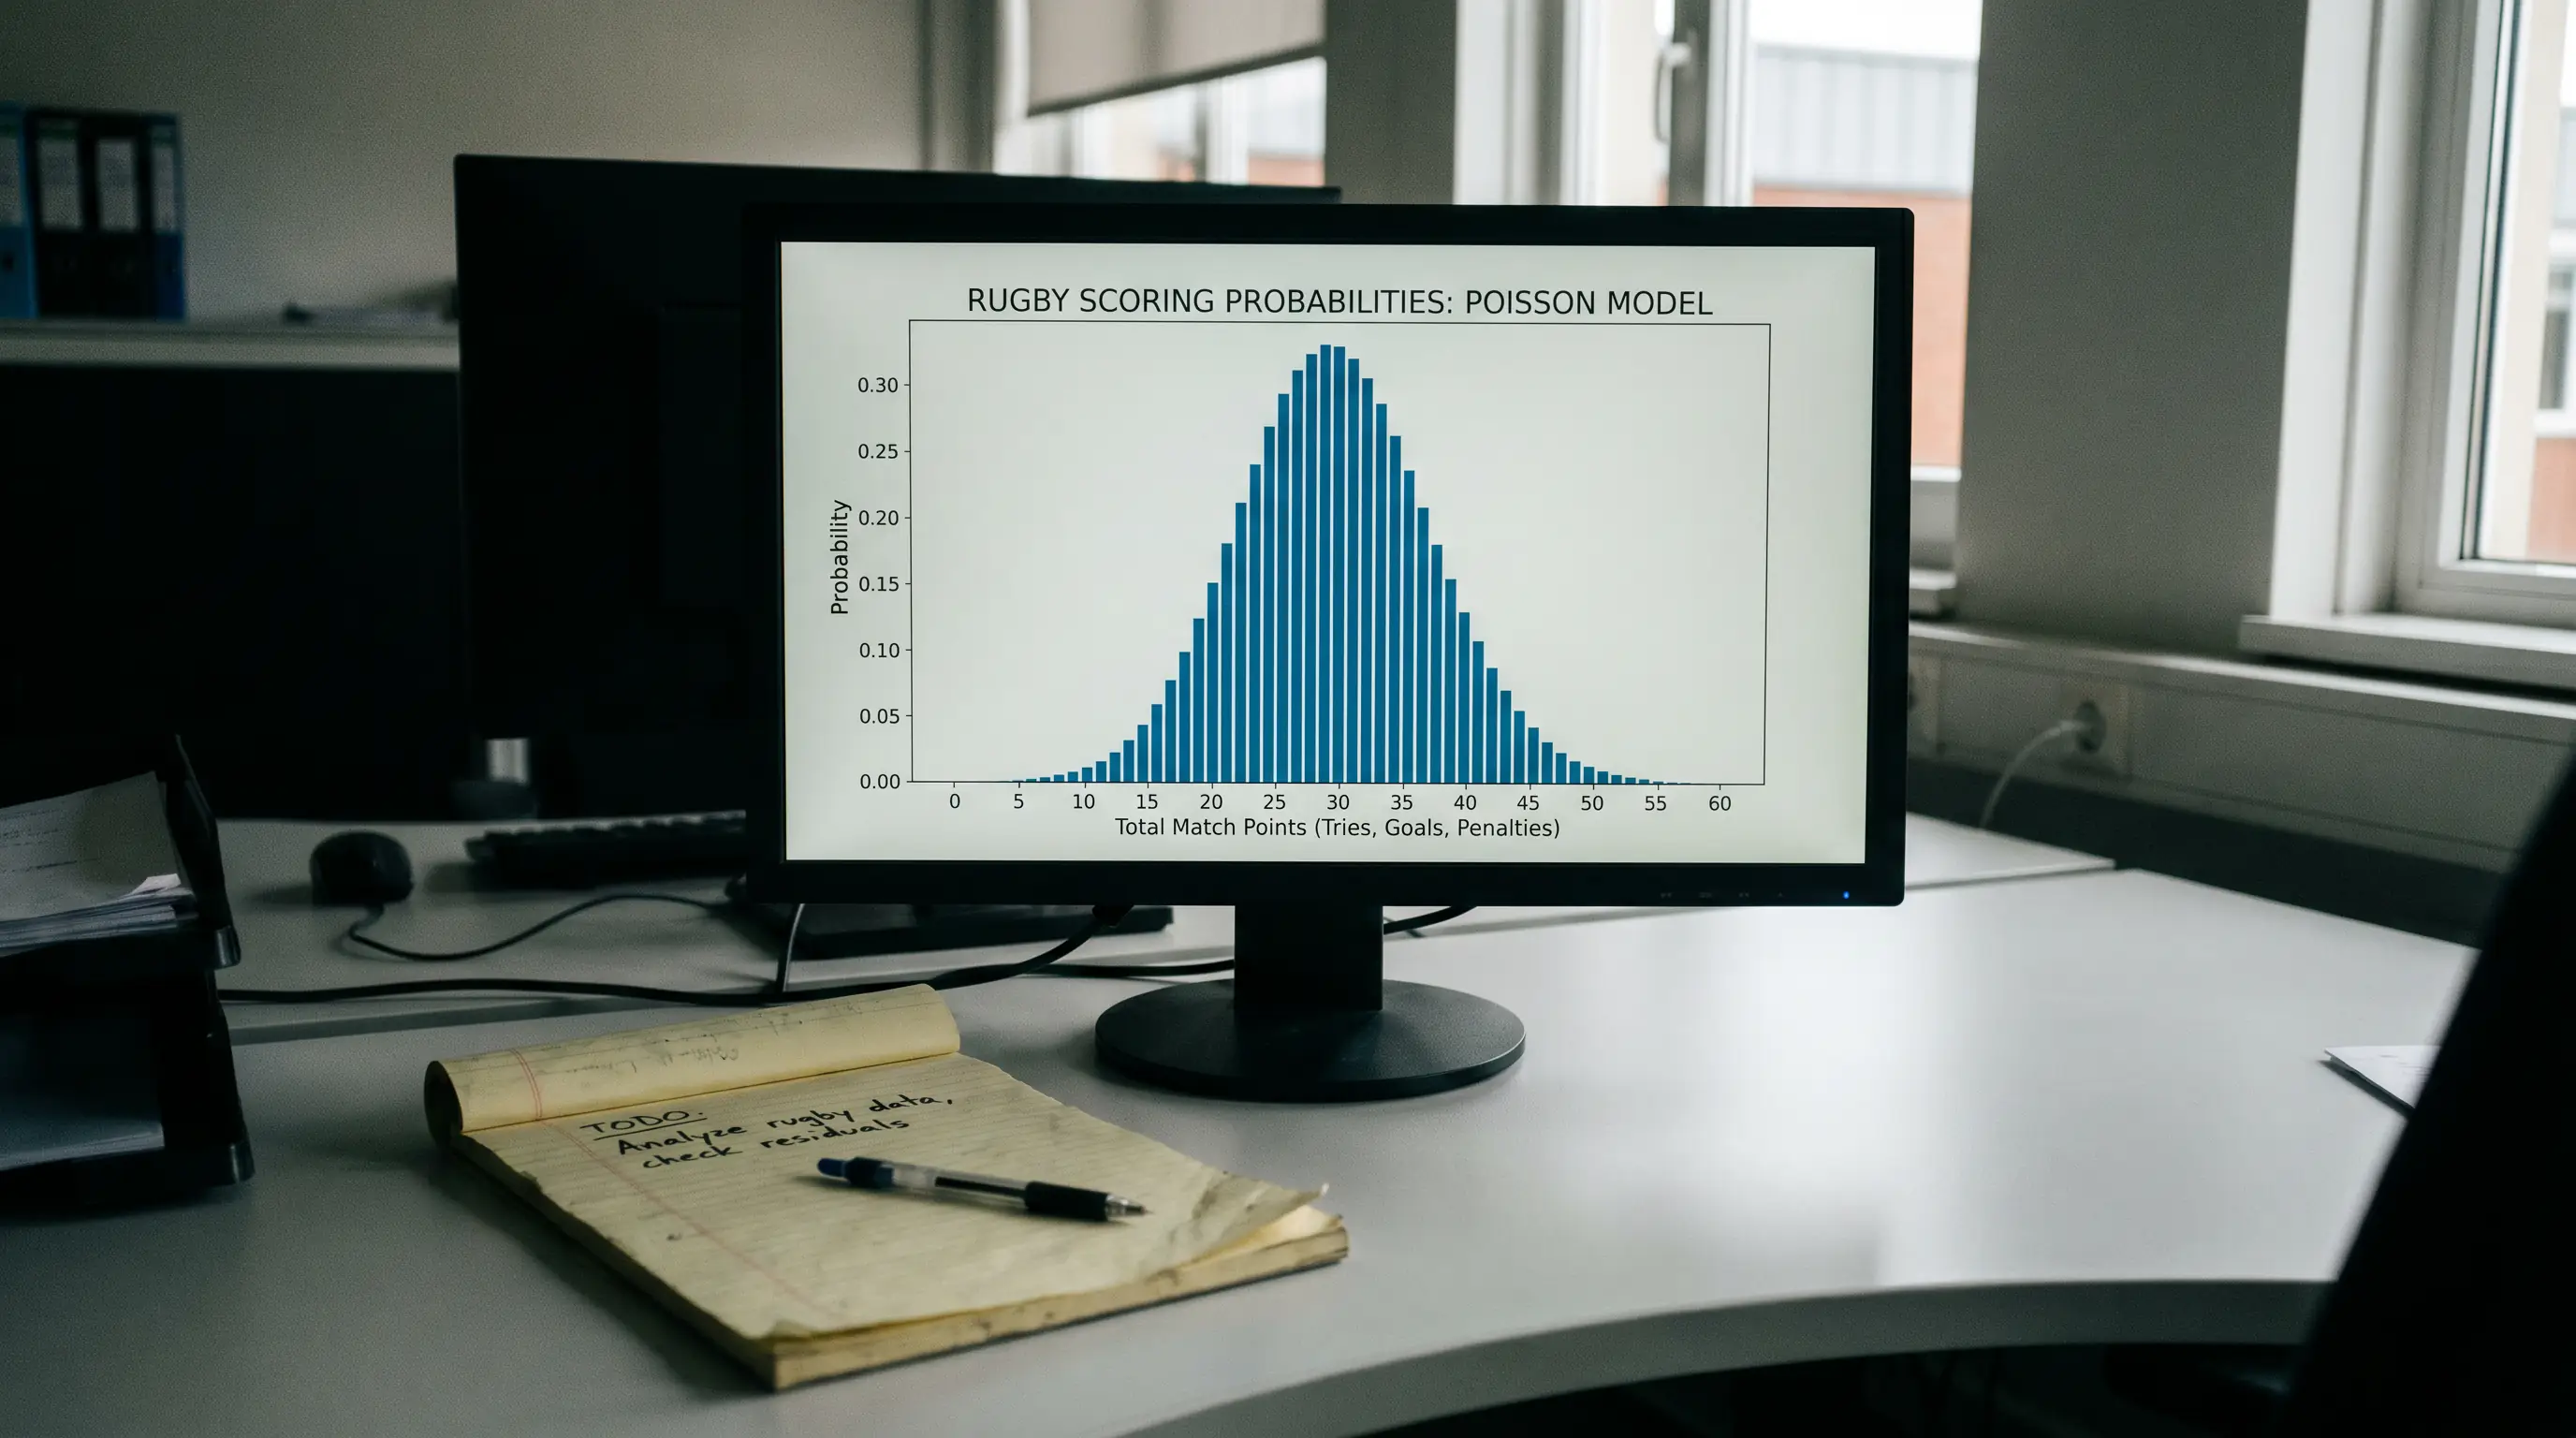
The foundation is the Poisson distribution, a statistical tool that models the probability of a given number of events occurring in a fixed interval. In rugby, those events are scoring actions: tries, conversions, penalties, and drop goals. The Six Nations 2025 averaged 55 points per match across fifteen fixtures, with France accumulating 218 points and Italy conceding 188. A Poisson model uses these kinds of averages — adjusted for opponent strength — to estimate the probability of each team scoring a specific number of points in a future match.
The elegance of Poisson is also its limitation. It assumes scoring events are independent, which is only approximately true in rugby. A team that scores an early try often gains a psychological and tactical advantage that increases their probability of scoring again. Despite this imperfection, the Poisson framework performs well enough as a baseline. The Six Nations 2026 produced 111 tries across its fifteen matches — 7.4 per game — and my Poisson-based model correctly predicted the direction of the total tries market in 11 of those fixtures.
The Inputs That Drive the Model
A model is only as good as what you feed it. The temptation is to throw every available data point into the mix, but that approach introduces noise faster than it adds signal. After extensive testing, I have settled on five core inputs that explain the majority of scoring variance in professional rugby.
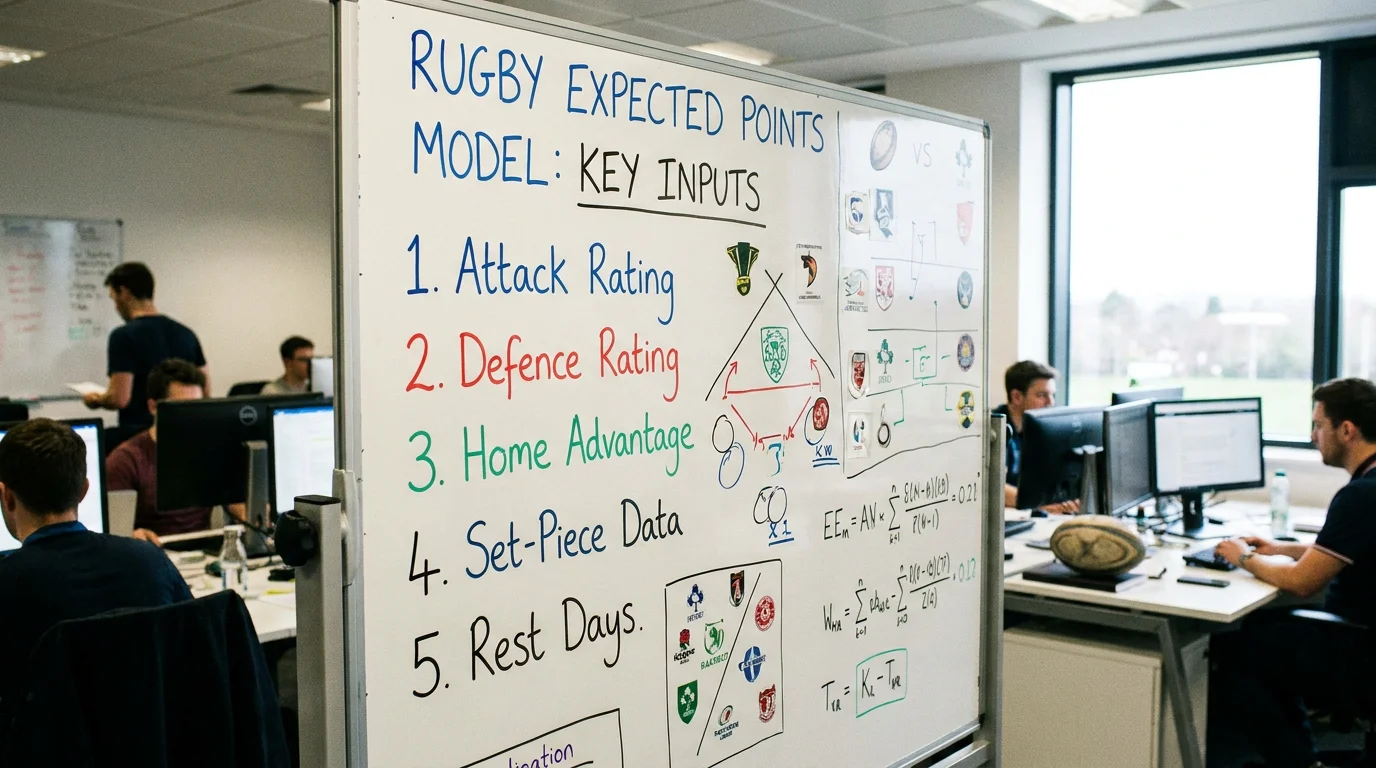
Attack rating is the first: a team’s average points scored per match over the last eight to ten fixtures, weighted so that recent matches count more heavily. Defence rating mirrors this — average points conceded, similarly weighted. Home advantage is the third input, applied as a flat modifier based on historical data for the specific venue. Fourth is rugby-specific statistical data like lineout success rate, scrum win percentage, and possession share, each of which correlates with scoring output at varying strengths. Fifth is rest days between fixtures — a variable that matters more in rugby than in most sports because of the physical recovery demands.
Over 800 million people globally express interest in rugby, yet only 24 million are classified as superfans of the professional club game. That narrow engaged audience means the volume of publicly available match data is thinner than in football or cricket. I supplement official statistics with my own match-by-match logging: tracking not just the final score but the number of entries into the opposition 22-metre zone, the conversion rate of those entries into points, and the ratio of kicks to carries in each half. These granular inputs, accumulated over three or four seasons, give the model resolution that headline statistics cannot.

A Step-by-Step Framework for Building Your Own
You do not need a statistics degree to build a functional expected points model. You need a spreadsheet, two seasons of historical data, and the patience to test your assumptions.
Start by collecting the results of every match in a single competition — the Premiership or Six Nations are the most accessible starting points. For each match, record the home team, away team, home score, away score, and the venue. From this dataset, calculate each team’s average points scored and conceded, both home and away separately. This gives you a basic attack and defence rating for every team.

Next, calculate the league-wide averages: mean home score, mean away score, mean total points. These serve as the baseline against which individual team ratings are measured. A team that scores 30 points per home match in a league averaging 24 has an attack rating of 1.25 (30 divided by 24). A team that concedes 18 points at home in a league averaging 22 has a defence rating of 0.82. Multiply the attacking team’s attack rating by the defending team’s defence rating and by the league average to get your expected score for each side.
Feed those expected scores into a Poisson distribution to generate probabilities for each possible scoreline. Free Poisson calculators are available online, or you can use the POISSON.DIST function in any spreadsheet application. Sum the probabilities where Team A’s score exceeds Team B’s for the home win probability, and so on. The entire calculation, once set up, takes under a minute per fixture.
Backtesting and Knowing When to Trust the Numbers
A model that has not been backtested is a hypothesis, not a tool. Backtesting means running your model against historical fixtures — matches whose outcomes you already know — and measuring how accurately it predicts results.
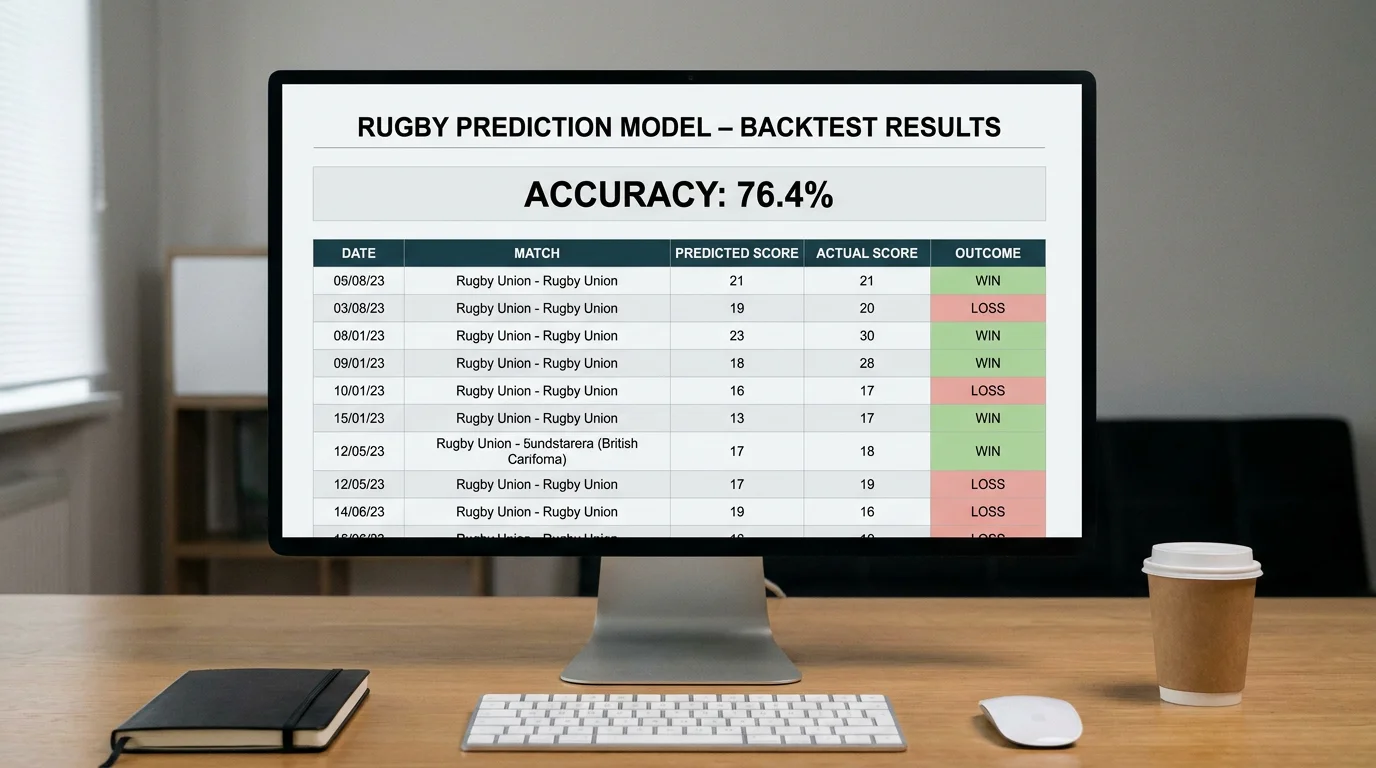
I backtest against two metrics: percentage of correct match outcomes predicted, and calibration accuracy. Calibration measures whether events your model assigns a 60% probability to actually occur roughly 60% of the time. A model that predicts 60% chances that win 80% of the time sounds good, but it is actually miscalibrated and will eventually cost you money because you are underpricing those outcomes and potentially missing value elsewhere.
My current model, after three years of refinement, correctly predicts the match winner in approximately 64% of Premiership fixtures and 68% of Six Nations matches. That is not spectacular, but it does not need to be — because the model’s primary purpose is not to pick winners. Its purpose is to generate probability estimates that I compare against the bookmaker’s implied probabilities. When my model says 55% and the bookmaker’s price implies 45%, I have a potential value bet. When the two agree, I stay out.

The single biggest mistake in model-building is over-fitting: adding variables until the model perfectly explains historical data but fails on new fixtures. If your model correctly predicts 85% of last season’s matches, it is probably memorising noise rather than learning patterns. Keep the inputs simple, test on data the model has not seen, and accept that 60-70% accuracy is genuinely useful when converted into a staking strategy applied over hundreds of bets.
What data do I need to build a basic rugby expected points model?
At minimum, you need two seasons of match results including home and away scores, team identities, and venues. From these you calculate attack ratings, defence ratings, and league averages, which feed into a Poisson distribution to generate match probabilities. More advanced models add lineout success, scrum win rate, and rest-day data.
How accurate are Poisson models for predicting rugby scores?
A well-calibrated Poisson model typically predicts the correct match winner in 60-68% of professional rugby fixtures. The model is better at estimating scoring ranges than exact scorelines, and its primary value for betting lies in generating probability estimates that can be compared against bookmaker odds to identify value.
