
 Available in US
Content

I once spent an entire pre-season building a model around possession percentage, convinced that controlling the ball was the single strongest predictor of match outcomes. After 40 Premiership matches, the correlation was embarrassingly weak — teams winning possession lost the match roughly 35% of the time, a figure that made the metric barely better than a coin toss for prediction purposes. That failure taught me something more valuable than any correct prediction: in rugby, the statistics that feel important and the statistics that actually predict results are often entirely different things.
The global rugby market is valued at $6.9 billion and projected to reach $11.9 billion by 2033. The data infrastructure supporting rugby analysis has grown rapidly alongside that commercial expansion, but most bettors still rely on a handful of headline metrics without understanding which numbers carry genuine predictive power. Mark Oliver has observed that rugby “needs to come up with ways to build outside its core markets and excite the next generation” — and data-driven analysis is one of those ways, both for the sport’s commercial strategy and for punters seeking an edge.
Key Metrics for Rugby Bettors
Not all statistics are created equal. Through three years of tracking correlations between pre-match metrics and match outcomes across the Six Nations and Premiership, I have identified a hierarchy of predictive value that looks nothing like the stats panel displayed during a television broadcast.
Tackle success rate is the single most predictive defensive metric I have found. Teams that maintain a tackle completion rate above 90% win a disproportionate share of their matches, because missed tackles create the line breaks that lead to tries. The Six Nations 2025 produced 108 tries in 15 matches (7.2 per game), and the majority of those tries originated from at least one missed tackle in the preceding phases. Average points per match across that tournament — 55 — were driven more by defensive lapses than attacking brilliance.

Lineout win percentage on own throw is the most predictive set-piece metric. A team that wins 95%+ of their own lineouts controls territory, builds attacking platform, and restricts the opponent’s scoring opportunities. By contrast, scrum win percentage is a weaker predictor than most people assume, because scrums produce slower ball and fewer immediate scoring chances than lineouts.
Discipline metrics — penalties conceded per match and yellow cards per match — are undervalued by the betting public. A team averaging 12+ penalties conceded per match is giving the opposition three to four free shots at goal and spending extended periods in defensive territory. France scored 218 points in the Six Nations 2025, and a significant portion came from opposition penalties that gave them field position inside the 22.

Predictive Metrics vs Descriptive Metrics
Here is the distinction that separates useful statistics from noise: a predictive metric is one that, when measured before or during a match, correlates with the eventual outcome. A descriptive metric tells you what happened after the fact but does not help you anticipate what will happen next.
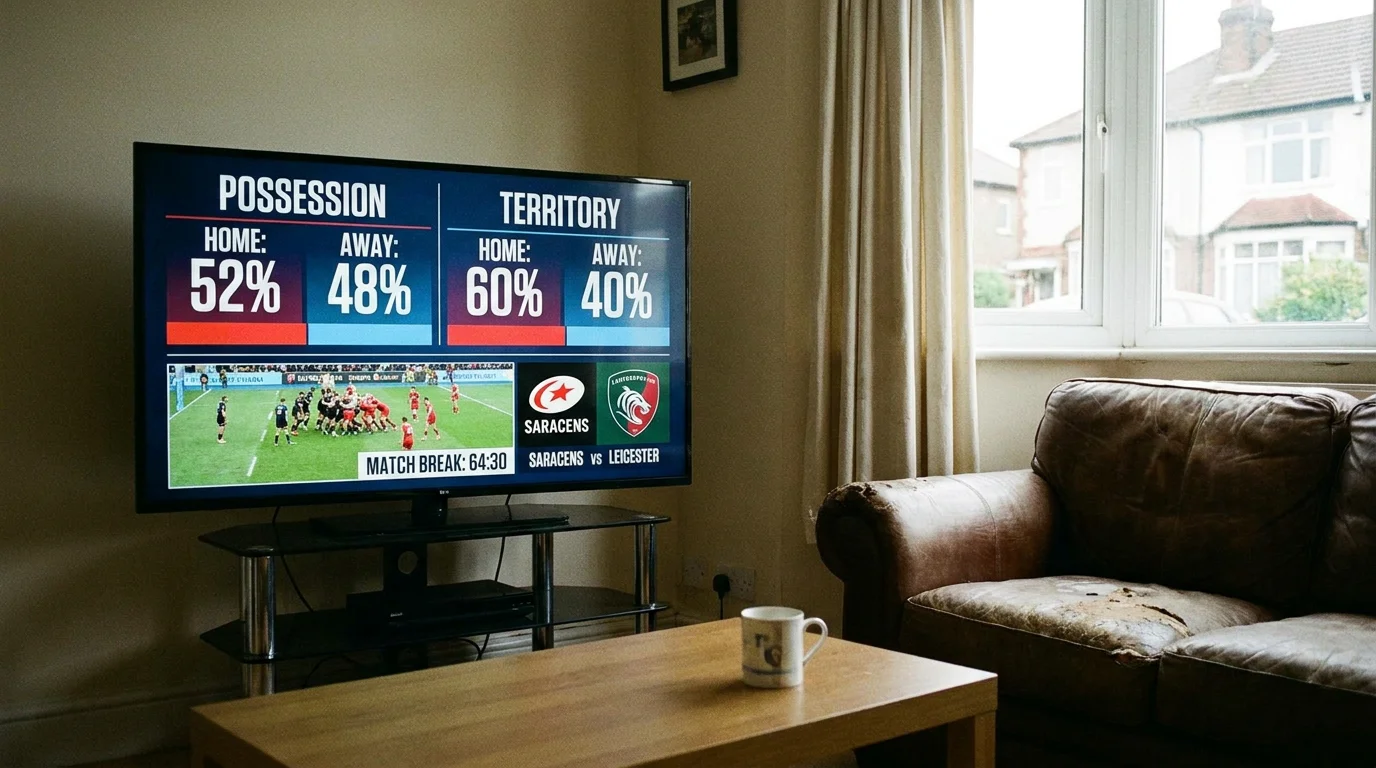
Possession is the classic descriptive metric. It tells you who had the ball more often, but it does not tell you who used the ball productively. A team can dominate possession while the opponent scores from counter-attacks and set-piece steals. Territory is slightly more predictive than possession, because time spent in the opposition half creates more scoring opportunities, but it still fails to account for the quality of those opportunities.
The metrics that carry genuine predictive weight for building a data model are: tackle success rate, lineout win percentage, metres gained per carry, clean breaks, and defenders beaten. These metrics measure the quality of action rather than the volume, and they correlate with points scored and conceded at a statistically significant level across multi-season datasets. When I compile pre-match analysis for a Six Nations fixture, these five numbers — averaged over the last six matches and weighted for recency — form the core of my expected performance profile for each team.
Where to Find Rugby Statistics
Over 800 million people globally express interest in rugby, but the sport’s statistical infrastructure remains less developed than football’s. The data landscape is improving rapidly, though, and free or low-cost sources now cover enough ground for the committed bettor to build a useful analytical framework.
Official competition websites (World Rugby, the Six Nations, Premiership Rugby, URC, and the LNR for Top 14) publish match statistics within 24 hours of each fixture. These include the standard set: possession, territory, tackles, lineouts, scrums, penalties, and carries. The depth varies by competition — the Six Nations provides detailed player-level data, while some domestic leagues offer only team-level summaries.
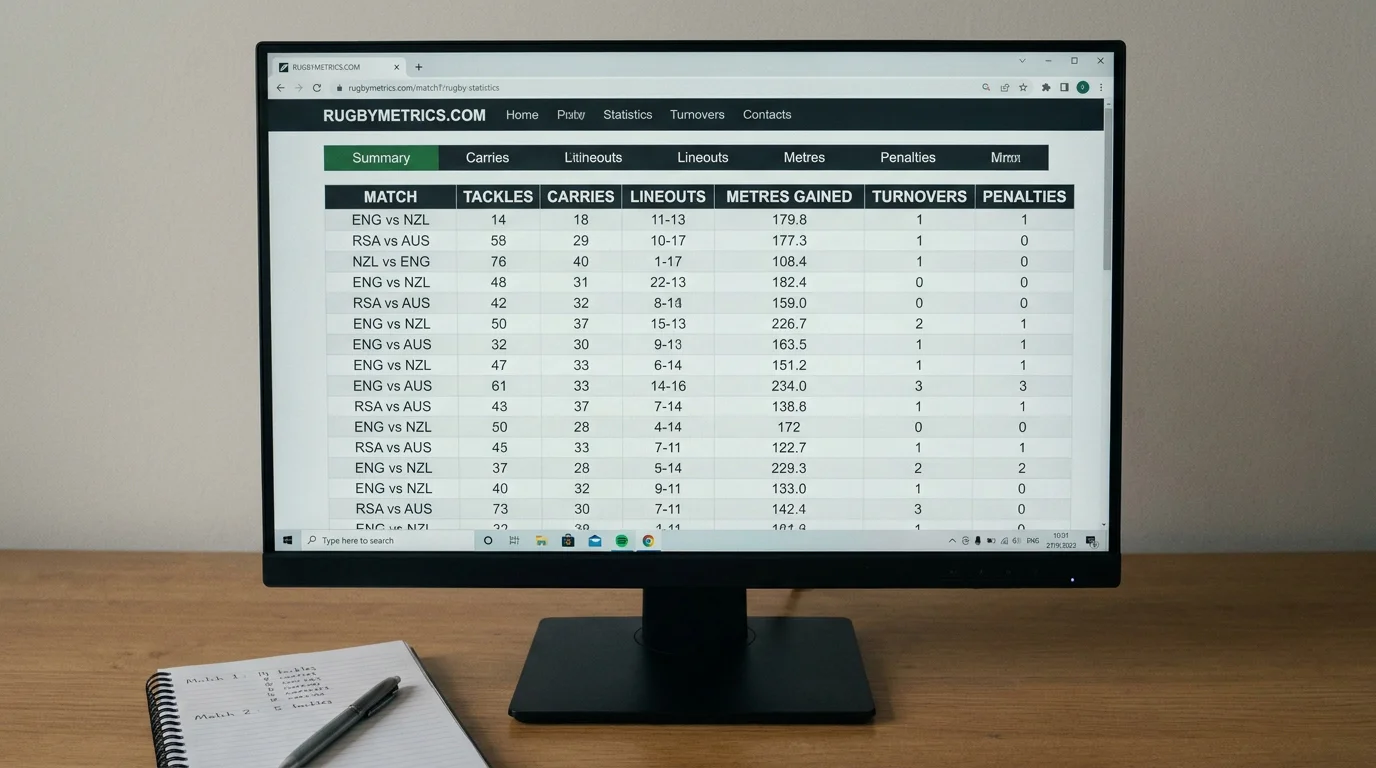
Third-party data providers offer deeper analysis. Opta (now Stats Perform) supplies the data behind most broadcast graphics and fantasy rugby platforms. Their metrics include expected points, tackle location data, and phase-by-phase breakdowns. Access to the full dataset requires a commercial subscription, but much of the summary data surfaces through media articles, podcasts, and free preview content before major fixtures.
My workflow: I maintain a spreadsheet for each competition I bet on, updated weekly with the five core metrics listed above. The data entry takes approximately 20 minutes per round of fixtures, and the cumulative dataset becomes increasingly valuable as the season progresses. By Round 10 of the Premiership, I have 100+ data points per team, which is enough to run meaningful comparisons against the bookmaker’s power ratings.
Limitations of Statistical Analysis in Rugby
The biggest limitation is sample size. A Six Nations campaign is five matches. A Premiership season is 18 league matches. Compared to football (38 league matches) or cricket (dozens of innings per season), rugby produces fewer data points per team per year, which makes every statistical finding less stable and more vulnerable to randomness.

The second limitation is context dependency. A tackle success rate of 92% against Italy means something very different from 92% against South Africa. Adjusting for opposition quality is essential, but with only five or six matches per team in an international window, the adjustments are based on small samples and introduce their own uncertainty. I treat every metric as a signal rather than a certainty, and I never let a single statistic drive a bet in isolation — it is always a combination of metrics, team news, and contextual factors that produces a betting decision.
The third limitation: rugby data does not capture intangibles like team morale, coaching changes, or travel fatigue with the same precision that it captures tackles and lineouts. These unmeasurable factors are real and significant, particularly in tournament rugby where emotional momentum can override statistical form. A data-driven approach to rugby betting is not a complete system — it is a framework that needs to be supplemented with qualitative judgement, and the bettor who relies solely on numbers will eventually be blindsided by a result that the data could not predict.
Which rugby statistics have the strongest correlation with match results?
Tackle success rate, lineout win percentage on own throw, and discipline metrics (penalties conceded) show the strongest correlations with match outcomes across multi-season datasets. Possession and territory, despite being the most widely cited statistics, are relatively weak predictors when analysed in isolation. Metres gained per carry and clean breaks provide the most reliable offensive indicators.
Where can I find free rugby match statistics for betting research?
Official competition websites (Six Nations, Premiership Rugby, URC, World Rugby) publish team-level and selected player-level statistics within 24 hours of each match. Fantasy rugby platforms also aggregate useful data. For deeper analysis, third-party providers like Stats Perform offer comprehensive datasets, though full access requires a subscription. Building a personal spreadsheet from free sources across a season provides enough data for meaningful betting analysis.
